By Fred Novomestky, Ph.D.
The blog on Asset Allocation and Gold set the stage for encouraging investors to consider the inclusion of gold as a strategic investment. I want to make it clear that there maybe a better alternative to just investing in gold and will get back to this point in the future.
We want to expand on the notion of allocation to gold futures by considering the effect of including gold futures in four illustrative portfolios. The component asset classes are U.S. large cap stocks, small cap stocks, long term government bonds, intermediate term government bonds and long term corporate bonds. We combine the two equity asset classes into a single stock sub-portfolio with perfect diversification as we described in the blog Asset Allocation, Diversification Now Passé?. We defined perfect diversification as an equally weighted portfolio in contrast to perfect concentration in which almost all the invested capital is allocation to one asset. The three bond asset classes are also combined into an equally weighted, perfectly diversified sub-portfolio.
The first of the portfolios consists of a 100% allocation to the stock sub-portfolio and we call it all stock. The second portfolio is called the all bond portfolio and consists of a 100% allocation to the bond sub-portfolio. The third portfolio consists of a 60% allocation to the stock sub-portfolio and a 40% allocation to the bond sub-portfolio. The fourth portfolio has a 40% allocation to the stock sub-portfolio and a 60% allocation to the bond sub-portfolio. A simple arithmetic calculation will reveal that there is a 20% allocation to each of the five asset classes that make up the portfolio and therefore this portfolio has perfect diversification.
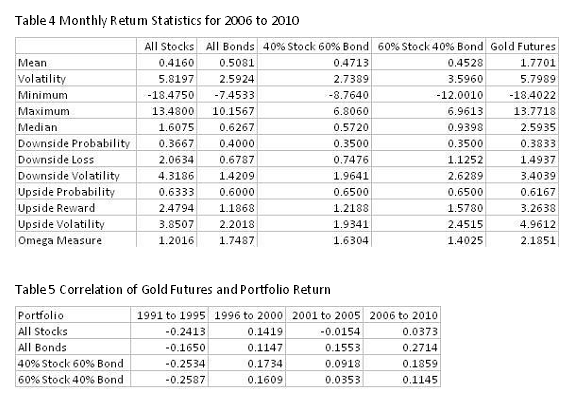
To maintain consistency with our previous analysis, we use monthly returns for the asset classes to compute the monthly returns of the four portfolios. Each portfolio is assumed to re-balance at the beginning of each month to the same weights that characterize the portfolio. The entire time period January 1991 to December 2010 is divided into four time periods: 1991 to 1995, 1996 to 2000, 2001 to 2005 and 2006 to 2010. The summary return statistics for each portfolio and gold futures are found in Tables 1 to 4. Except for the 2006 to 2010 time period, the 40% stock 60% bond portfolio has the highest omega measure showing the value of perfect diversification.
We use the same proxy for gold futures investment as in the previous blog, namely, the Dow Jones UBS gold futures total return index. Table 5 shows the correlation of gold futures to each of the portfolios. In 1991 to 1995, all the correlations were negative in the subsequent time periods, there were positive but not necessarily significant.
Figures 1 to 4 highlight the omega measure over a range of allocations to gold from 0% (the traditional asset class investor) to 100% (the gold commodity trading advisor) for each of the four time periods. All portfolios in all time periods benefit from the incorporation of gold futures. An allocation to gold futures between 10% and 40% shows the 40% stock 60% bond having the best lower partial moment risk adjusted performance.
What is interesting to note is that as is the case with asset classes the investor benefits from the inclusion of gold in their portfolio. In the next blog we continue with our analysis of gold investing in pursuit of the portfolio with minimum downside loss.
Click to Enlarge
Sponsored by: EMA Softech


No comments:
Post a Comment