Wednesday, September 21, 2011

Portfolio Strategy and Gold

By Fred Novomestky, Ph.D.

The blog on Asset Allocation and Gold set the stage for encouraging investors to consider the inclusion of gold as a strategic investment. I want to make it clear that there maybe a better alternative to just investing in gold and will get back to this point in the future.

We want to expand on the notion of allocation to gold futures by considering the effect of including gold futures in four illustrative portfolios. The component asset classes are U.S. large cap stocks, small cap stocks, long term government bonds, intermediate term government bonds and long term corporate bonds. We combine the two equity asset classes into a single stock sub-portfolio with perfect diversification as we described in the blog Asset Allocation, Diversification Now Passé?. We defined perfect diversification as an equally weighted portfolio in contrast to perfect concentration in which almost all the invested capital is allocation to one asset. The three bond asset classes are also combined into an equally weighted, perfectly diversified sub-portfolio.

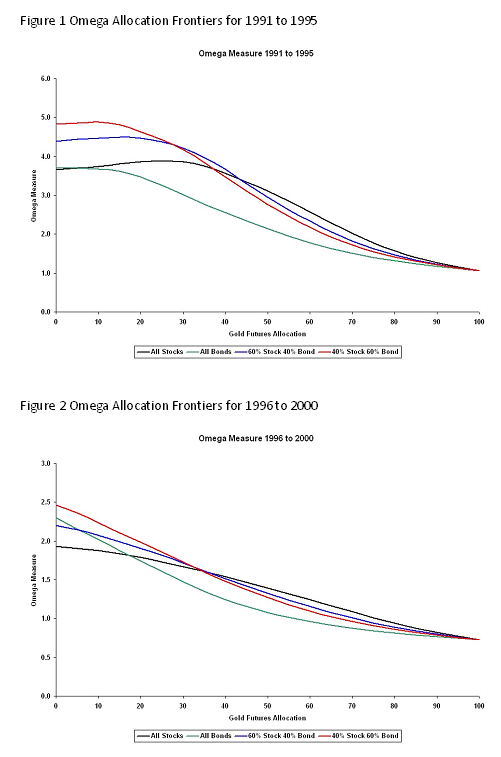
The first of the portfolios consists of a 100% allocation to the stock sub-portfolio and we call it all stock. The second portfolio is called the all bond portfolio and consists of a 100% allocation to the bond sub-portfolio. The third portfolio consists of a 60% allocation to the stock sub-portfolio and a 40% allocation to the bond sub-portfolio. The fourth portfolio has a 40% allocation to the stock sub-portfolio and a 60% allocation to the bond sub-portfolio. A simple arithmetic calculation will reveal that there is a 20% allocation to each of the five asset classes that make up the portfolio and therefore this portfolio has perfect diversification.

To maintain consistency with our previous analysis, we use monthly returns for the asset classes to compute the monthly returns of the four portfolios. Each portfolio is assumed to re-balance at the beginning of each month to the same weights that characterize the portfolio. The entire time period January 1991 to December 2010 is divided into four time periods: 1991 to 1995, 1996 to 2000, 2001 to 2005 and 2006 to 2010. The summary return statistics for each portfolio and gold futures are found in Tables 1 to 4. Except for the 2006 to 2010 time period, the 40% stock 60% bond portfolio has the highest omega measure showing the value of perfect diversification.

We use the same proxy for gold futures investment as in the previous blog, namely, the Dow Jones UBS gold futures total return index. Table 5 shows the correlation of gold futures to each of the portfolios. In 1991 to 1995, all the correlations were negative in the subsequent time periods, there were positive but not necessarily significant.

Figures 1 to 4 highlight the omega measure over a range of allocations to gold from 0% (the traditional asset class investor) to 100% (the gold commodity trading advisor) for each of the four time periods. All portfolios in all time periods benefit from the incorporation of gold futures. An allocation to gold futures between 10% and 40% shows the 40% stock 60% bond having the best lower partial moment risk adjusted performance.

What is interesting to note is that as is the case with asset classes the investor benefits from the inclusion of gold in their portfolio. In the next blog we continue with our analysis of gold investing in pursuit of the portfolio with minimum downside loss.


Click to Enlarge


Sponsored by: EMA Softech


Friday, September 9, 2011

Asset Allocation and Gold

By Fred Novomestky, Ph.D.


In my previous blog, The Prudent Investor and Gold, I looked at the long term behavior of traditional asset class returns and the gold spot returns. We established that the flat-currency price of gold will by flat or decline when real returns on assets are high. Conversely, when real returns have been low or stagnant, then gold has been strong.

We also found a surprise in that these correlations are not really meaningful. In fact, for all intent and purposes, gold spot returns are uncorrelated with the returns of U.S. stocks and bonds. This is still good news for the investor.

At a time when investors are seeing dizzying movements in gold prices, the prudent investor would like to know the answer to three questions. First, should I have a strategic exposure to gold in my portfolio? Second, what are reasonable allocations to gold? Finally, how can invest in gold? In this blog, we will try to answer the first two questions using partial moment analysis that was introduced in the blog, Partial Moments – the Up and Down of Performance and Risk . Let’s tackle the third question first.

Currently, there are three ways to create an exposure to gold price movements in a portfolio. A traditional approach is to invest in a mutual fund of equity shares for those companies that have earnings linked to gold price movements. These may be companies that mine gold or companies that created products made of gold. Academics and practitioners have found this a poor proxy for gold price movements because their earnings may be affected by economic factors other than gold. A second approach is to invest in gold futures contracts that are fully margined by cash in a risk free portfolio. This means, for example, a $10,000,000 exposure to the most liquid gold futures contracts is collateralized with a $10,000,000 margin account. The investor has to manage variation margin and the roll of futures contract before the likelihood of taking delivery of actual gold. Finally, the investor can use an exchanged traded fund like the iShares Gold Fund.

We will use the second approach and represent the performance of such a trading strategy with the daily returns of the Dow Jones UBS Commodity Index component for gold futures. The daily return series carefully takes into account the full margining and control roll. The data used for the analytical portion of this blog can be found on http://www.djindexes.com.

We derive monthly returns of gold futures that are then compared to the monthly returns of traditional U.S. capital market investments in U.S. large and small cap stocks, long and intermediate term government bonds and long term corporate bonds. In contrast to the previous blog, we look at four time periods each of five calendar years in duration. The time periods are 1991 to 1995, 1996 to 2000, 2001 to 2005 and 2006 to 2010. Tables 1 to 4 provide the summary statistics for these asset class, spot gold and gold futures for each of these time periods. The differences you see between gold spot and gold futures are due to the characteristics of futures pricing and contract rolls relative to the simple London pricing fixing of spot gold prices. Furthermore, from Table 5, the correlation between gold spot and futures returns are virtually one indicating that the futures trading in gold is an excellent proxy for spot trading.

The next question is how much to allocation to gold for each of the traditional capital market investments described above. We use the omega measure that defined in the blog, The Prudent Investor and Gold. For a given target level, it is the upside reward divided by the downside loss and provides a target return basis of defining risk adjusted returns very much like Sharpe ratios. We now consider simple portfolios that combine each of the five traditional asset classes with an exposure to gold futures. For each time horizon and gold futures allocation, we compute the returns of a portfolio that is rebalanced monthly to begin each month with the same gold allocation. The omega measure is then computed for each portfolio.

Figures 1 to 5 highlight the omega measure over a range of allocations to gold from 0% (the traditional asset class investor) to 100% (the gold commodity trading advisor) for each of the asset classes and for each of the four time periods. The optimal allocation to gold futures is that exposure that produces the highest omega measure. For U.S. stocks there is such a value except for the 1996 to 2000 time period in which gold is not a good diversifying investment. For fixed income investments, the benefit of gold allocation is noticeable since 2001.

What is interesting to note is that generally speaking across all asset classes and time periods the investor benefits from the inclusion of gold in their portfolio from as little as 10% (very conservative) to 40% (very aggressive). In the next blog we continue with our analysis of gold investing.

Click to Enlarge


Sponsored by: EMA Softech