There has been considerable interest, discussion and debate on investing in gold since the recessionary period that started in 2008. Regular television viewers have been barraged with advertisements saying that it has never been a better time to move a portion or all of our assets into gold investments. The current downgrade of U.S. debt by Standard & Poors has fueled aggressive trading in the gold spot and futures markets.
The article by John Dizzard in the May 9, 2011 edition of the Financial Times Monthly Review on the Fund Management Industry has an attention grabbing title, “Reasons not to fondle your gold”. He carefully reminds the reader that gold is “real” money. Real money, un-invested in any opportunity, does not earn any return. We are talking here about gold as precious metal or hard currency. Warren Buffet was quoted as saying that if you owned all the gold in the world it would not earn anything for you. On the other hand, if you owned all the farmland in the U.S. and several large oil companies you could earn something, the “stuff”.
John Dizzard references a study that was performed by Larry Summers and Robert Barksy, Gibson’s Paradox and the Gold Standard, in 1985 [see the article at http://www.gata.org/files/gibson.pdf ]. The authors found a “Strong co-movement between the inverse relative price of gold and the real interest rates ….”. That is, if real interest rates on bonds or equity yields are high, holders of money have more incentive to use their cash to buy assets.
In a multi-year investment strategy, the flat-currency price of gold will by flat or decline when real returns on assets are high. Conversely, when real returns have been low or stagnant, then gold has been strong.
The author closes by saying that in the current economic environment gold is a useful capital preserver. Over decades staying in cash rather than earning assets is fruitless.
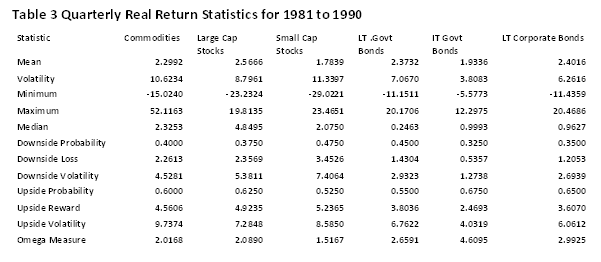
We are going to do a simple test of the research by Summers and Barksy using the quarterly real returns for the five equity and fixed income asset classes that were used in the blog on Purchasing Power and Commodities [provide a link]. We consider four (4) ten year time periods: 1971 to 1980, 1981 to 1990, 1991 to 2000, and 2001 to 2010.
The gold prices used for the empirical analysis were downloaded from the web site of the World Gold Council, http://www.gold.org. The gold price used on this site is the London PM fix. This price is quoted in US dollars. Where the gold price is presented in currencies other than the US dollar, it is converted into the local currency unit using the foreign exchange rate closing price on the same day...
Economists and statisticians have used a measure called correlation to quantify the statistical dependency between pairs of financial variables. The correlation measure takes on values between -1 and +1. Our financial variables are quarterly growth rates in the spot price of gold and the real returns of U.S. stocks and bonds. When the correlation between two variables is close to +1, we say that an increase in one variable is most often accompanied by an increase in the other variable. At the other extreme, when the correlation is close to -1, then an increase in one variable is most likely accompanied by a decrease in the other variable.
Tables 1 to 4 summarize the estimated correlations between gold and each of the financial asset returns over the four time periods. The column of interest is the first column and, specifically, the values below the first row which are highlighted in bold. These represent the correlation between gold growth rates and the real returns of the assets. The theory as set forth by Summer and Barksy would suggest negative correlations with stock real returns and positive correlation with bond returns (similar to the negative correlation with real interest rates).
There are several observations that are noteworthy. The first is that, in general, there is a slight negative correlation between gold returns and real returns of stocks but only in three of four ten year periods. The second observation is the general positive correlation between gold returns and bond real returns but not in all ten year periods. It is also interesting to note that the magnitude of the correlations between gold and financial assets is small. The statistician would run a test to determine if these correlations are really different from zero. The report would indicate that they are not really different from zero as one would expect in the correlation between risky assets and a risk-less investment.
The long term investor can benefit from a strategic exposure to gold in their portfolio just as cash is a powerful diversifying instrument. Then again, gold is just real money.
Click to Enlarge

Sponsored by: EMA Softech