The current wide swings and volatility in both the financial and commodity markets continue to provide opportunities for and challenges to the investor. Gold prices recently dropped dramatically only to be followed by increases as the equity markets have moved upwards. My previous blogs show how adding gold to financial assets and portfolios of these assets over long time periods can result in significant rewards. Well, it turns out that the inclusion of gold in portfolios can help reduce downside losses as well.
In the blog Partial Moments – the Up and Down of Performance and Risk we showed charts that presented upside reward and downside volatility for each of several asset classes. These charts were compared to the traditional investment opportunity sets. While downside volatility is a more interesting choice for volatility than traditional return volatility, downside loss, the lower partial moment of order 1, is a more compelling measure of the pain or loss to the investor when investment results fall below the target level. A more useful chart is upside reward versus downside loss. We will call this the upside reward downside loss frontier.
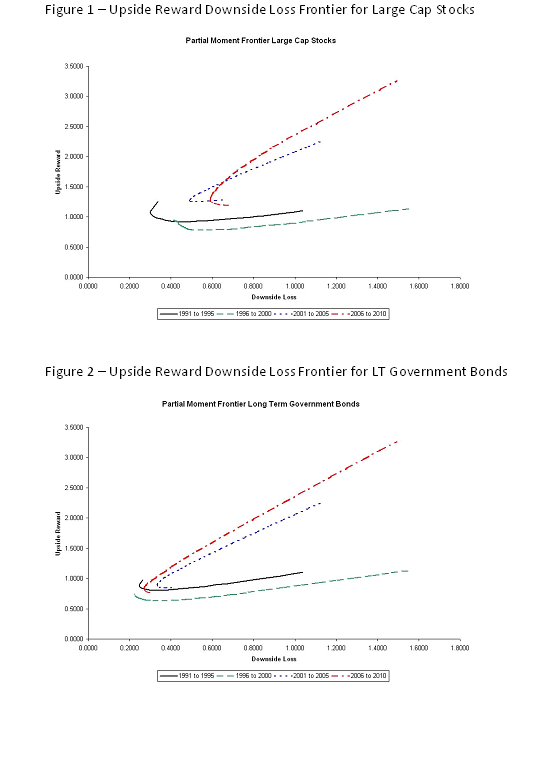
Figures 1 and 2 show these frontiers for large capitalization stocks and long term government bonds combined with gold futures, respectively. Notice that each chart has four curves, one for each of four time periods. The time periods are 1991 to 1995, 1996 to 2000, 2001 to 2005 and 2006 to 2010. Each curve shows how upside reward and downside loss varies as you change the allocation between the asset class and gold futures. The data used to construct these curves are found in Tables 1 and 2. There are pairs of columns for each time period. The column labeled lpm.1 is the downside loss measure and the column labeled upm.1 is the upside reward measure. The target level is 0 implying an aversion to negative returns.
Notice that as you follow each curve there is, in most cases, a point on the curve that is the leftmost point. This is the portfolio with the smallest downside loss. For many investors this is becoming an attractive investment strategy. Finding the allocation to gold futures that result in the minimum downside loss portfolio is a challenging portfolio design problem but we will illustrate a way to get a reasonable answer.
Let’s focus on Table 1 and the pair of columns for 1991 to 1995. Notice that the lpm.1 values decrease as you increase the allocation to gold futures until you reach the minimum value. Thereafter the values increase. At the bottom of the column is the minimum value of all the numbers in the column which is 0.3017. All you have to do is locate that value in the column that corresponds to the minimum and highlight it. This value is highlighted and corresponds to a 15% allocation to gold futures. The similarly computed numbers for the other times are highlighted for the other time periods.
Table 3 summarizes the determination of gold allocations that result in minimum downside loss for each of the asset classes we have been using in the recent blogs and for each of time periods. Notice that except for small stocks, no asset class in the 1996 to 2000 time period benefited from a loss minimization through an exposure to gold. I invite you to review the previous blogs that summarize asset class return statistics for this time period. Another important result is that equity asset classes require a higher exposure to gold to achieve the minimum downside loss than the fixed income asset classes.
The blog Portfolio Strategy and Gold discussed the effect of including gold futures as part of the allocation to four different portfolios. The portfolio are (1) all stocks, (2) all bonds, (3) 40% stocks and 60% bonds and (4) 60% stocks and 40% bonds. Figures 3 to 6 present the corresponding upper reward downside loss frontiers for these portfolios combined with gold futures and each time period. The inclusion of gold futures in virtually all portfolios and all time periods has the benefit of reducing the prospects of downside loss. Table 4 summarized the minimum downside loss allocations to gold futures for these portfolios and time periods. Once again, portfolios with higher allocations to equities require more gold exposure to reduce downside loss. The 40% stock 60% bond portfolio is the equal weighted portfolio of all asset classes and hence the perfectly diversified portfolio. This is the portfolio with a 20% allocation to gold futures.
The exposure to gold can provide attractive returns and risk management as well. The challenge for investors is to decide whether they have the appetite for permanent large commitments to gold in their portfolios. We have already looked at the use of a variety of commodities in portfolios to protect purchasing power. We return to this asset classes to view the tradeoff of upside reward and downside loss in the next blog.
Click to Enlarge


Sponsored by: EMA Softech
Your blogs on including gold in a portfolio have been interesting and timely. I wonder, however, if the inclusion of gold is analogous to the inclusion of cash which, in all cases, will reduce downside loss during a declining market cycle. Does your research show that gold can act like a hedge; reducing risk while having a limited effect on upside returns? And if so, how can you differentiate between the gold downside protection vs. the simple benefit of diversification into a non-correlated asset class.
ReplyDelete